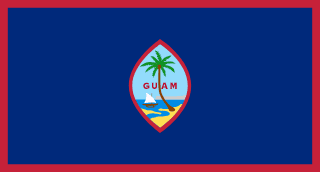
Guam - Geography

Here, let us take a look at the Geography of Guam. Largest and southernmost island in the Mariana Islands archipelago and the largest island in Micronesia; strategic location in western North Pacific Ocean. Mother's mean age at first birth is (), whereas, the Maternal mortality ratio is
Geographical data of Guam
| Location | Oceania, island in the North Pacific Ocean, about three-quarters of the way from Hawaii to the Philippines |
|---|---|
| Geographic coordinates | 13 28 N, 144 47 E |
| Map references | Oceania |
| Tarrain | volcanic origin, surrounded by coral reefs; relatively flat coralline limestone plateau (source of most fresh water), with steep coastal cliffs and narrow coastal plains in north, low hills in center, mountains in south |
| Natural Resources | aquatic wildlife (supporting tourism), fishing (largely undeveloped) |
| Natural Hazards | frequent squalls during rainy season; relatively rare but potentially destructive typhoons (June to December) |
| Irrigated Land | 2 sq km (2012) |
| Major rivers (by length in km) | |
| Major aquifers | |
| Land Boundaries | 0 km |
| Border Countries | |
| Coastline | 125.5 km |
| Climate | tropical marine; generally warm and humid, moderated by northeast trade winds; dry season (January to June), rainy season (July to December); little seasonal temperature variation |
| Area | |
| Total Area | |
| Land Area | 544 sq km |
| Water Area | 0 sq km |
| comparative Area | three times the size of Washington, D.C. |
| Maritime Claims | |
| Territorial sea | 12 nm |
| Exclusive economic zone | 200 nm |
| Elevations | |
| Highest point | Mount Lamlam 406 m |
| Lowest point | Pacific Ocean 0 m |
| Land Use | |
| Agricultural land | 29.6% (2023 est.) |
| Agricultural land: arable land | arable land: 1.9% (2023 est.) |
| Agricultural land: permanent crops | permanent crops: 13% (2023 est.) |
| Agricultural land: permanent pasture | permanent pasture: 14.8% (2023 est.) |
| Forest | 52.4% (2023 est.) |
| Other | 18% (2023 est.) |
Population Distribution
No large cities exist on the island; large villages (municipalities) attract much of the population; the largest of these is Dededo
People and Society
In Guam, the different Ethnic groups are such that we have: Native Hawaiian and other Pacific Islander 46.1% (Chamorro 32.8%, Chuukese 6.7%, Palauan 1.4%, Pohnpeian 1.4%, Yapese 1%, other Native Hawaiian and other Pacific Islander 2.8%), Asian 35.5% (Filipino 29.1%, Korean 2.2%, Japanese 1.4%, Chinese (except Taiwanese) 1.3%, other Asian 1.5%), White 6.8%, African descent or African-American 0.9%, Indigenous 0.1%, other 0.6%, mixed 10% (2020 est.)
| Population | |
|---|---|
| Pop growth rate | 0.08% (2025 est.) |
| Birth rate | 17.9 births/1,000 population (2025 est.) |
| Death rate | 6.18 deaths/1,000 population (2025 est.) |
| Health expenditure | |
| Physicians Density | |
| Hospital bed Density | |
| Total fertility rate | 2.7 children born/woman (2025 est.) |
| Gross reproduction rate | 1.31 (2025 est.) |
| Contraceptive prevalence rate | |
| Est married women (ages 15-49) | 40.4% (2020 est.) |
| Literacy | |
| Education expenditures | |
| Net Migration rate | -10.92 migrant(s)/1,000 population (2025 est.) |
| Nationality | Guamanian | Guamanian(s) (US citizens) |
| Languages | English 43.3%, Filipino 24.9%, Chamorro 16%, other Pacific Island languages 9.4%, Asian languages 6.5% (2020 est.) |
| Religions | Christian (predominantly Roman Catholic) 94.2%, folk religions 1.5%, Buddhist 1.1%, other 1.6%, unaffiliated 1.7% (2020 est.) |
| Age Structure | |
| 0-14 years | 26.4% (male 23,139/female 21,632) |
| 15-64 years | 62.7% (male 55,591/female 50,741) |
| 65 years and over | 10.9% (2024 est.) (male 8,615/female 9,814) |
| Dependency Ratios | |
| Total dependency ratio | 59.4 (2024 est.) |
| Youth dependency ratio | 42.1 (2024 est.) |
| Elderly dependency ratio | 17.3 (2024 est.) |
| Potential support ratio | 5.8 (2024 est.) |
| Median Age | |
| Total | 30.5 years (2025 est.) |
| Male | 29.6 years |
| Female | 31.1 years |
| Urbanization | |
| Urban population | 95.2% of total population (2022) |
| Rate of urbanization | 0.84% annual rate of change (2020-25 est.) |
| Major urban areas (Pop) | 147,000 HAGATNA (capital) (2018). |
| Sex Ratio | |
| At birth | 1.07 male(s)/female |
| 0-14 years | 1.07 male(s)/female |
| 15-64 years | 1.1 male(s)/female |
| 65 years and over | 0.88 male(s)/female |
| Total population | 1.06 male(s)/female (2024 est.) |
| Infant Motality | |
| Total | 10.7 deaths/1,000 live births (2025 est.) |
| Male | 11 deaths/1,000 live births |
| Female | 10.9 deaths/1,000 live births |
| Life Expectancy at birth | |
| Total population | 78 years (2024 est.) |
| Male | 75.6 years |
| Female | 80.5 years |
| Drinking Water Sources | |
| Improved: total | total: 99.7% of population (2022 est.) |
| Unimproved: total | total: 0.3% of population (2022 est.) |
| Sanitation facility acess | |
| Improved: total | total: 99.2% of population (2022 est.) |
| Unimproved: total | total: 0.8% of population (2022 est.) |
Demographic profile
All Important Facts about Guam
Want to know more about Guam? Check all different factbooks for Guam below.


