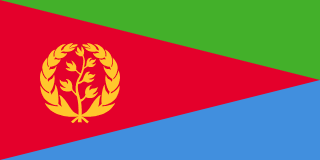
Eritrea - Geography

Here, let us take a look at the Geography of Eritrea. Strategic geopolitical position along world's busiest shipping lanes. Mother's mean age at first birth is 21.3 years (2010 est.) (Note: data represents median age at first birth among women 25-29), whereas, the Maternal mortality ratio is 291 deaths/100,000 live births (2023 est.)
Geographical data of Eritrea
| Location | Eastern Africa, bordering the Red Sea, between Djibouti and Sudan |
|---|---|
| Geographic coordinates | 15 00 N, 39 00 E |
| Map references | Africa |
| Tarrain | dominated by extension of Ethiopian north-south trending highlands, descending on the east to a coastal desert plain, on the northwest to hilly terrain and on the southwest to flat-to-rolling plains |
| Natural Resources | gold, potash, zinc, copper, salt, possibly oil and natural gas, fish |
| Natural Hazards | frequent droughts, rare earthquakes and volcanoes; locust swarms volcanism: Dubbi (1,625 m), which last erupted in 1861, was the country's only historically active volcano until Nabro (2,218 m) came to life in 2011 |
| Irrigated Land | 210 sq km (2012) |
| Major rivers (by length in km) | |
| Major aquifers | |
| Land Boundaries | 1,840 km |
| Border Countries | Djibouti 125 km; Ethiopia 1,033 km; Sudan 682 km |
| Coastline | 2,234 km (mainland on Red Sea 1,151 km; islands in Red Sea 1,083 km) |
| Climate | hot, dry desert strip along Red Sea coast; cooler and wetter in the central highlands (up to 61 cm of rainfall annually, heaviest June to September); semiarid in western hills and lowlands |
| Area | |
| Total Area | |
| Land Area | 101,000 sq km |
| Water Area | 16,600 sq km |
| comparative Area | slightly smaller than Pennsylvania |
| Maritime Claims | |
| Territorial sea | 12 nm |
| Elevations | |
| Highest point | Soira 3,018 m |
| Lowest point | near Kulul within the Danakil Depression -75 m |
| Mean elevation | 853 m |
| Land Use | |
| Agricultural land | 62.7% (2023 est.) |
| Agricultural land: arable land | arable land: 5.7% (2023 est.) |
| Agricultural land: permanent crops | permanent crops: 0% (2023 est.) |
| Agricultural land: permanent pasture | permanent pasture: 56.9% (2023 est.) |
| Forest | 12% (2023 est.) |
| Other | 25.3% (2023 est.) |
Population Distribution
Density is highest in the center of the country, in and around the cities of Asmara (capital) and Keren; smaller settlements exist in the north and south, as shown in this population distribution map
People and Society
In Eritrea, the different Ethnic groups are such that we have: Tigrinya 50%, Tigre 30%, Saho 4%, Afar 4%, Kunama 4%, Bilen 3%, Hedareb/Beja 2%, Nara 2%, Rashaida 1% (2021 est.)
| Population | |
|---|---|
| Pop growth rate | 1.12% (2024 est.) |
| Birth rate | 26.3 births/1,000 population (2024 est.) |
| Death rate | 6.5 deaths/1,000 population (2024 est.) |
| Health expenditure | |
| Physicians Density | |
| Hospital bed Density | 1 beds/1,000 population (2020 est.) |
| Total fertility rate | 3.43 children born/woman (2024 est.) |
| Gross reproduction rate | 1.69 (2024 est.) |
| Contraceptive prevalence rate | |
| Est married women (ages 15-49) | 52.3% (2023 est.) |
| Literacy | |
| Education expenditures | |
| Net Migration rate | -8.7 migrant(s)/1,000 population (2024 est.) |
| Nationality | Eritrean | Eritrean(s) |
| Languages | Tigrinya (official), Arabic (official), English (official), Tigre, Kunama, Afar, other Cushitic languages |
| Religions | Eritrean Orthodox, Roman Catholic, Evangelical Lutheran, Sunni Muslim |
| Age Structure | |
| 0-14 years | 35.7% (male 1,138,382/female 1,123,925) |
| 15-64 years | 60.3% (male 1,882,547/female 1,944,266) |
| 65 years and over | 4% (2024 est.) (male 101,504/female 153,332) |
| Dependency Ratios | |
| Total dependency ratio | 65.8 (2024 est.) |
| Youth dependency ratio | 59.1 (2024 est.) |
| Elderly dependency ratio | 6.7 (2024 est.) |
| Potential support ratio | 15 (2024 est.) |
| Median Age | |
| Total | 21.3 years (2024 est.) |
| Male | 20.8 years |
| Female | 21.8 years |
| Urbanization | |
| Urban population | 43.3% of total population (2023) |
| Rate of urbanization | 3.67% annual rate of change (2020-25 est.) |
| Major urban areas (Pop) | 1.073 million ASMARA (capital) (2023). |
| Sex Ratio | |
| At birth | 1.03 male(s)/female |
| 0-14 years | 1.01 male(s)/female |
| 15-64 years | 0.97 male(s)/female |
| 65 years and over | 0.66 male(s)/female |
| Total population | 0.97 male(s)/female (2024 est.) |
| Infant Motality | |
| Total | 39.8 deaths/1,000 live births (2024 est.) |
| Male | 46.6 deaths/1,000 live births |
| Female | 32.8 deaths/1,000 live births |
| Life Expectancy at birth | |
| Total population | 67.5 years (2024 est.) |
| Male | 64.9 years |
| Female | 70.2 years |
| Alcohol consumption per capita | |
| Total | 0.93 liters of pure alcohol (2019 est.) |
| Beer | 0.42 liters of pure alcohol (2019 est.) |
| Wine | 0 liters of pure alcohol (2019 est.) |
| Spirits | 0 liters of pure alcohol (2019 est.) |
| Other alcohols | 0.51 liters of pure alcohol (2019 est.) |
| Tobacco use | |
| Total | 7.5% (2020 est.) |
| Male | 14.7% (2020 est.) |
| Female | 0.2% (2020 est.) |
Demographic profile
All Important Facts about Eritrea
Want to know more about Eritrea? Check all different factbooks for Eritrea below.


